
Seaborn Tutorial for Beginners#
Introduction#
Seaborn is a Python data visualization library based on matplotlib. It provides a high-level interface for drawing attractive and informative statistical graphics.
Installation#
You can install Seaborn using pip:
pip install seaborn
Importing Seaborn#
To use Seaborn in your code, you need to import it. It’s also common to import matplotlib for additional customization and pandas for data manipulation:
import seaborn as sns
import matplotlib.pyplot as plt
import pandas as pd
print(sns.__version__)
0.12.2
Loading Data#
Seaborn comes with built-in datasets for testing and demonstration. You can load a dataset using sns.load_dataset():
df = pd.read_csv('https://raw.githubusercontent.com/mwaskom/seaborn-data/master/tips.csv')
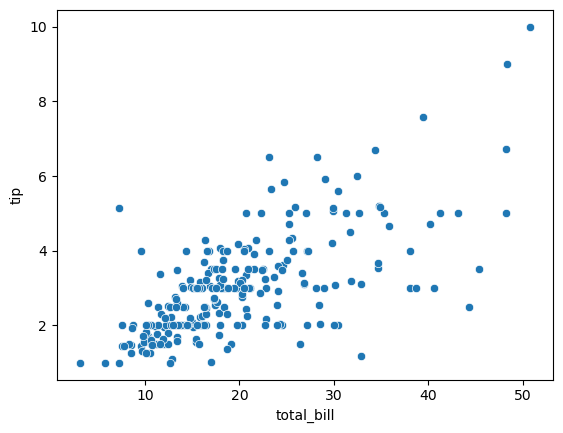
Creating a Scatter Plot#
Here’s how you can create a scatter plot with Seaborn:
sns.scatterplot(x='total_bill', y='tip', data=df)
plt.show()
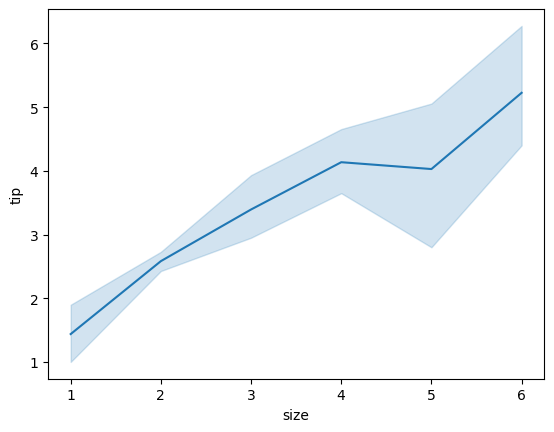
Creating a Line Plot#
Here’s how you can create a line plot with Seaborn:
sns.lineplot(x='size', y='tip', data=df)
plt.show()
/Users/zhuyunye/miniconda3/envs/pybook/lib/python3.10/site-packages/seaborn/_oldcore.py:1119: FutureWarning: use_inf_as_na option is deprecated and will be removed in a future version. Convert inf values to NaN before operating instead.
  with pd.option_context('mode.use_inf_as_na', True):
/Users/zhuyunye/miniconda3/envs/pybook/lib/python3.10/site-packages/seaborn/_oldcore.py:1119: FutureWarning: use_inf_as_na option is deprecated and will be removed in a future version. Convert inf values to NaN before operating instead.
  with pd.option_context('mode.use_inf_as_na', True):
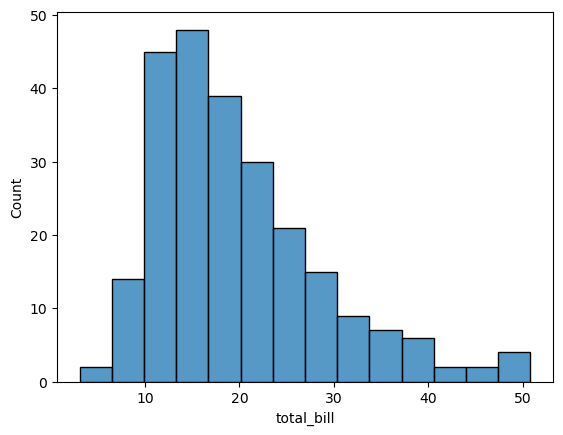
Creating a Histogram#
Here’s how you can create a histogram with Seaborn:
sns.histplot(df['total_bill'])
plt.show()
/Users/zhuyunye/miniconda3/envs/pybook/lib/python3.10/site-packages/seaborn/_oldcore.py:1119: FutureWarning: use_inf_as_na option is deprecated and will be removed in a future version. Convert inf values to NaN before operating instead.
  with pd.option_context('mode.use_inf_as_na', True):
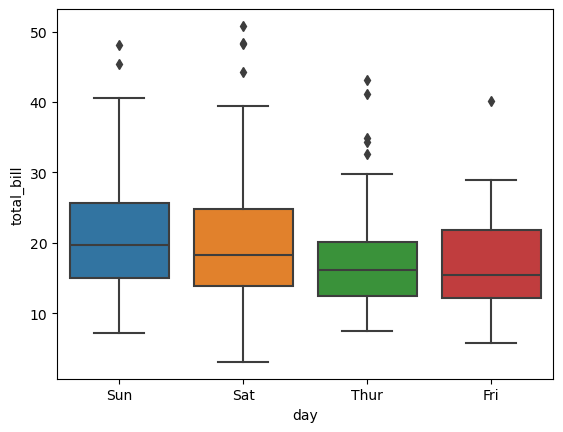
Creating a Box Plot#
Here’s how you can create a box plot with Seaborn:
sns.boxplot(x='day', y='total_bill', data=df)
plt.show()
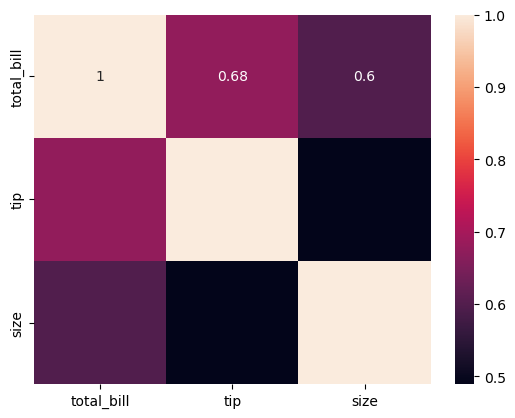
Creating a Heatmap#
Here’s how you can create a heatmap with Seaborn:
correlation = df[['total_bill','tip','size']].corr()
sns.heatmap(correlation, annot=True)
plt.show()
This is a very basic introduction to Seaborn. Seaborn has many more features and plot types which you can explore in the official documentation.